This portfolio is a collection of projects that showcases my skills in building machine learning solutions using the Python programming language. These projects use well-known Python libraries such as Pandas, NumPy, TensorFlow, and Scikit-learn to build practical, real-world applications. The portfolio usually contains a range of projects that include image recognition, data analysis, text analysis, hyper optimization, and predictive modeling, among others. The purpose of this portfolio is to demonstrate my expertise in the field of machine learning while showcasing my ability to create high-quality, effective, and scalable solutions.
Extra Tree Regression Model:
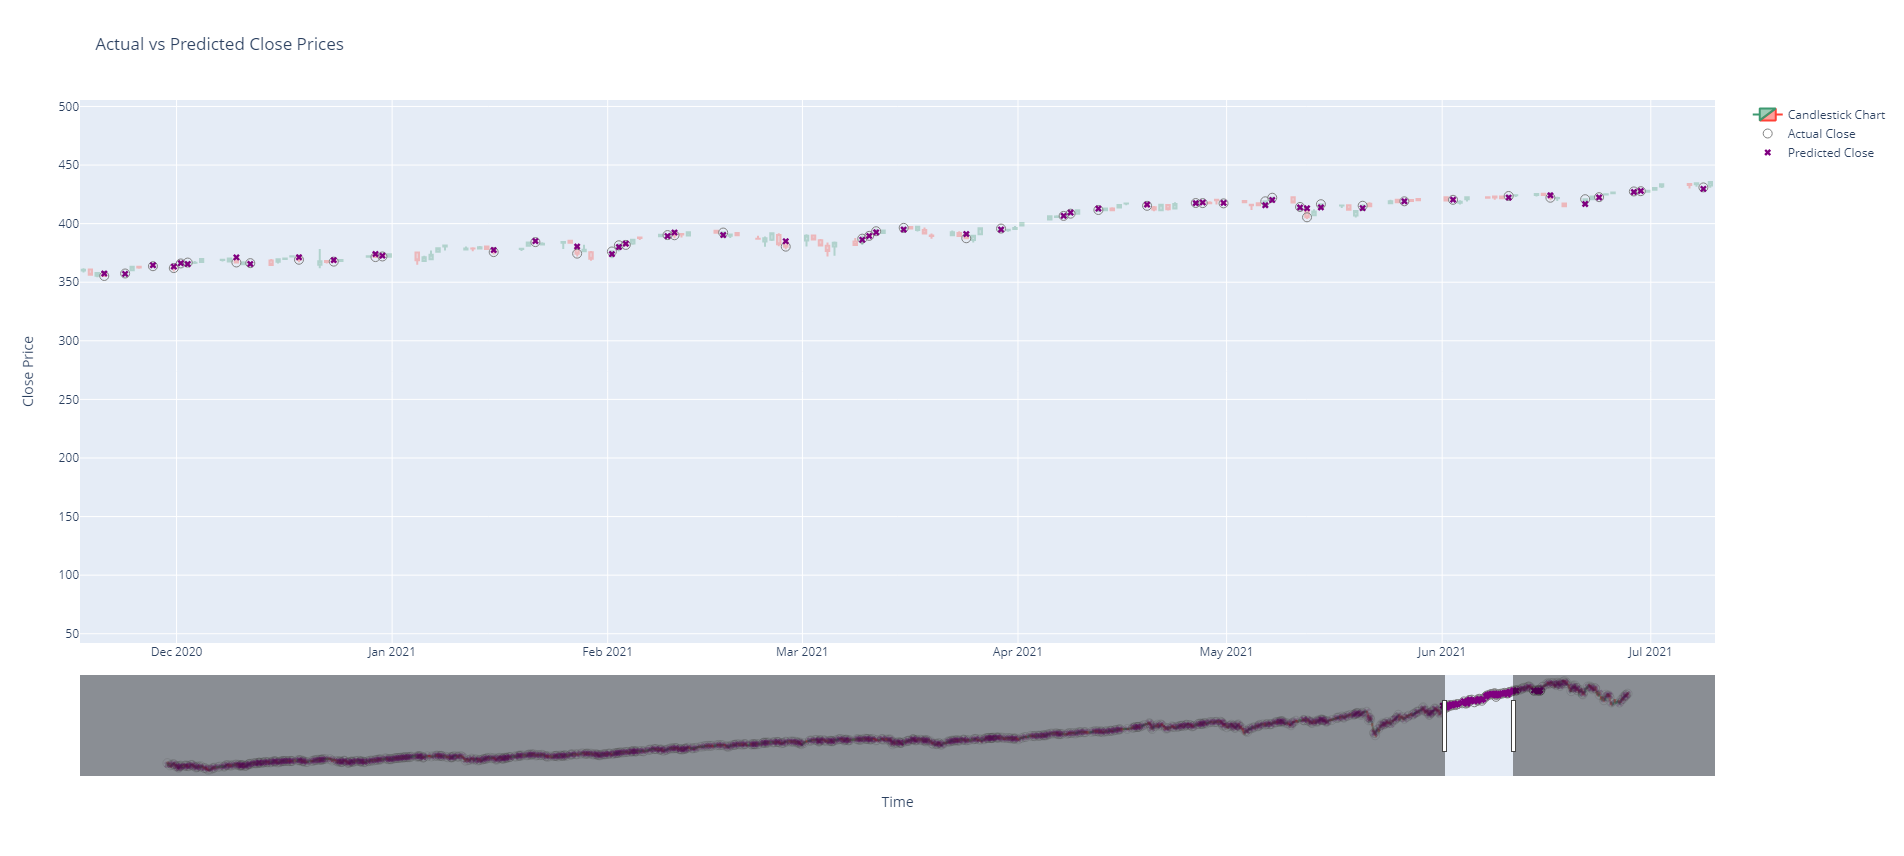
I had fun creating this regression model, where I trained it with 20 years of historical data from the stock market. After training the model, I inputted a series of daily opening prices, and the model predicted the closing price for each day. As shown below, the model's prediction in purple correlates remarkably well with the actual stock market closing price in gray.
Linear Regression Model:
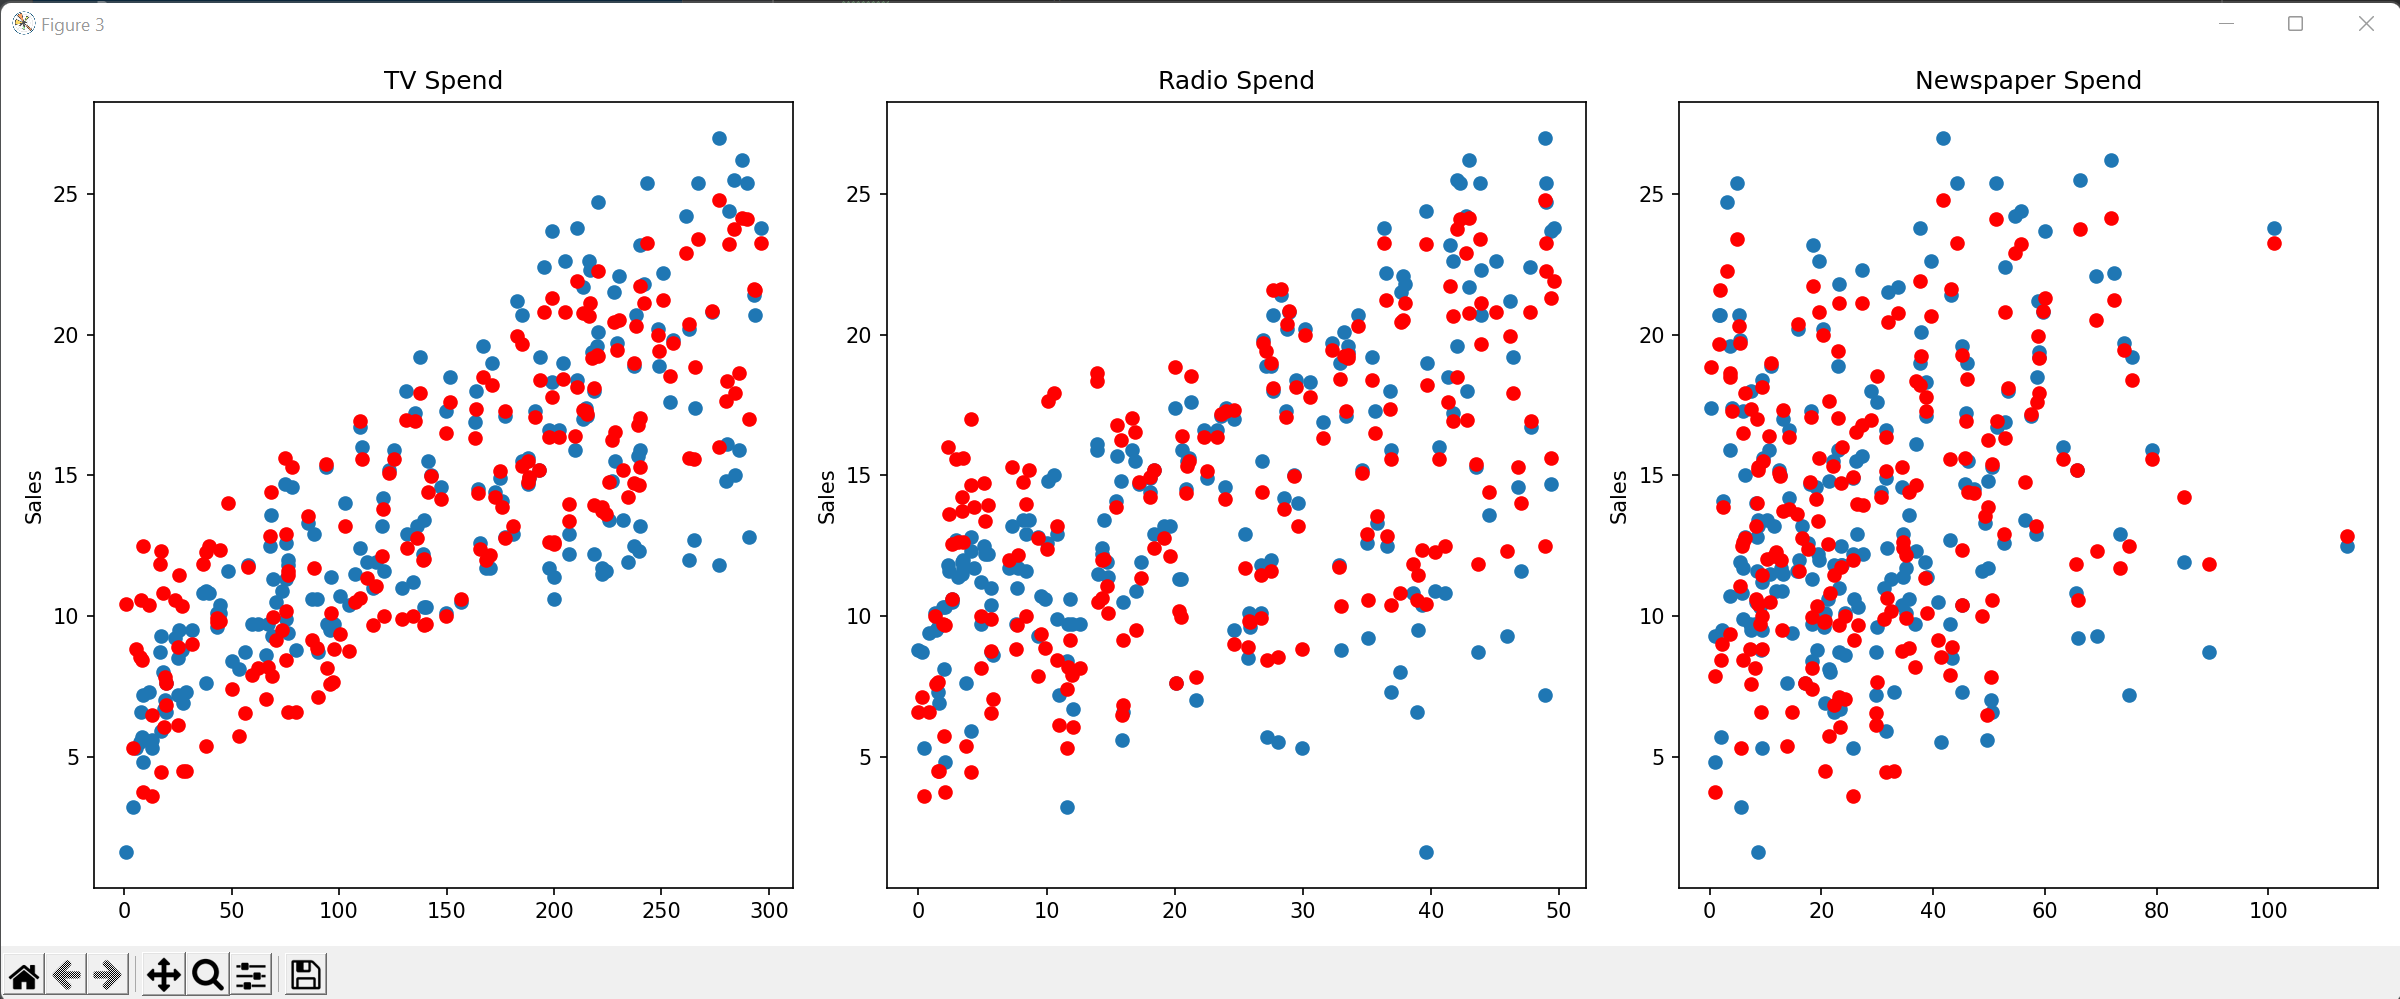
I wanted to create a model that predicts the number of sales based on the amount that a business spends on ads from TV, newspaper, and radio. In this case, the independent variables are the amounts spent on ads from TV, newspaper, and radio, while the dependent variable is the number of sales generated. By inputting historical data into the model, it can calculate the coefficients for each independent variable and provide an equation that can be used to predict future sales based on ad spend. This model is commonly used in marketing to evaluate the ROI of different advertising channels and to optimize marketing budgets for businesses. The red dot in the graph represents the predicted sales based on the ad spend, while the blue dot represents the actual sales made for that day, providing an opportunity to assess the accuracy of the trained model and determine the correlation between sales and money spent on ads.
Polynomial Regression Model:
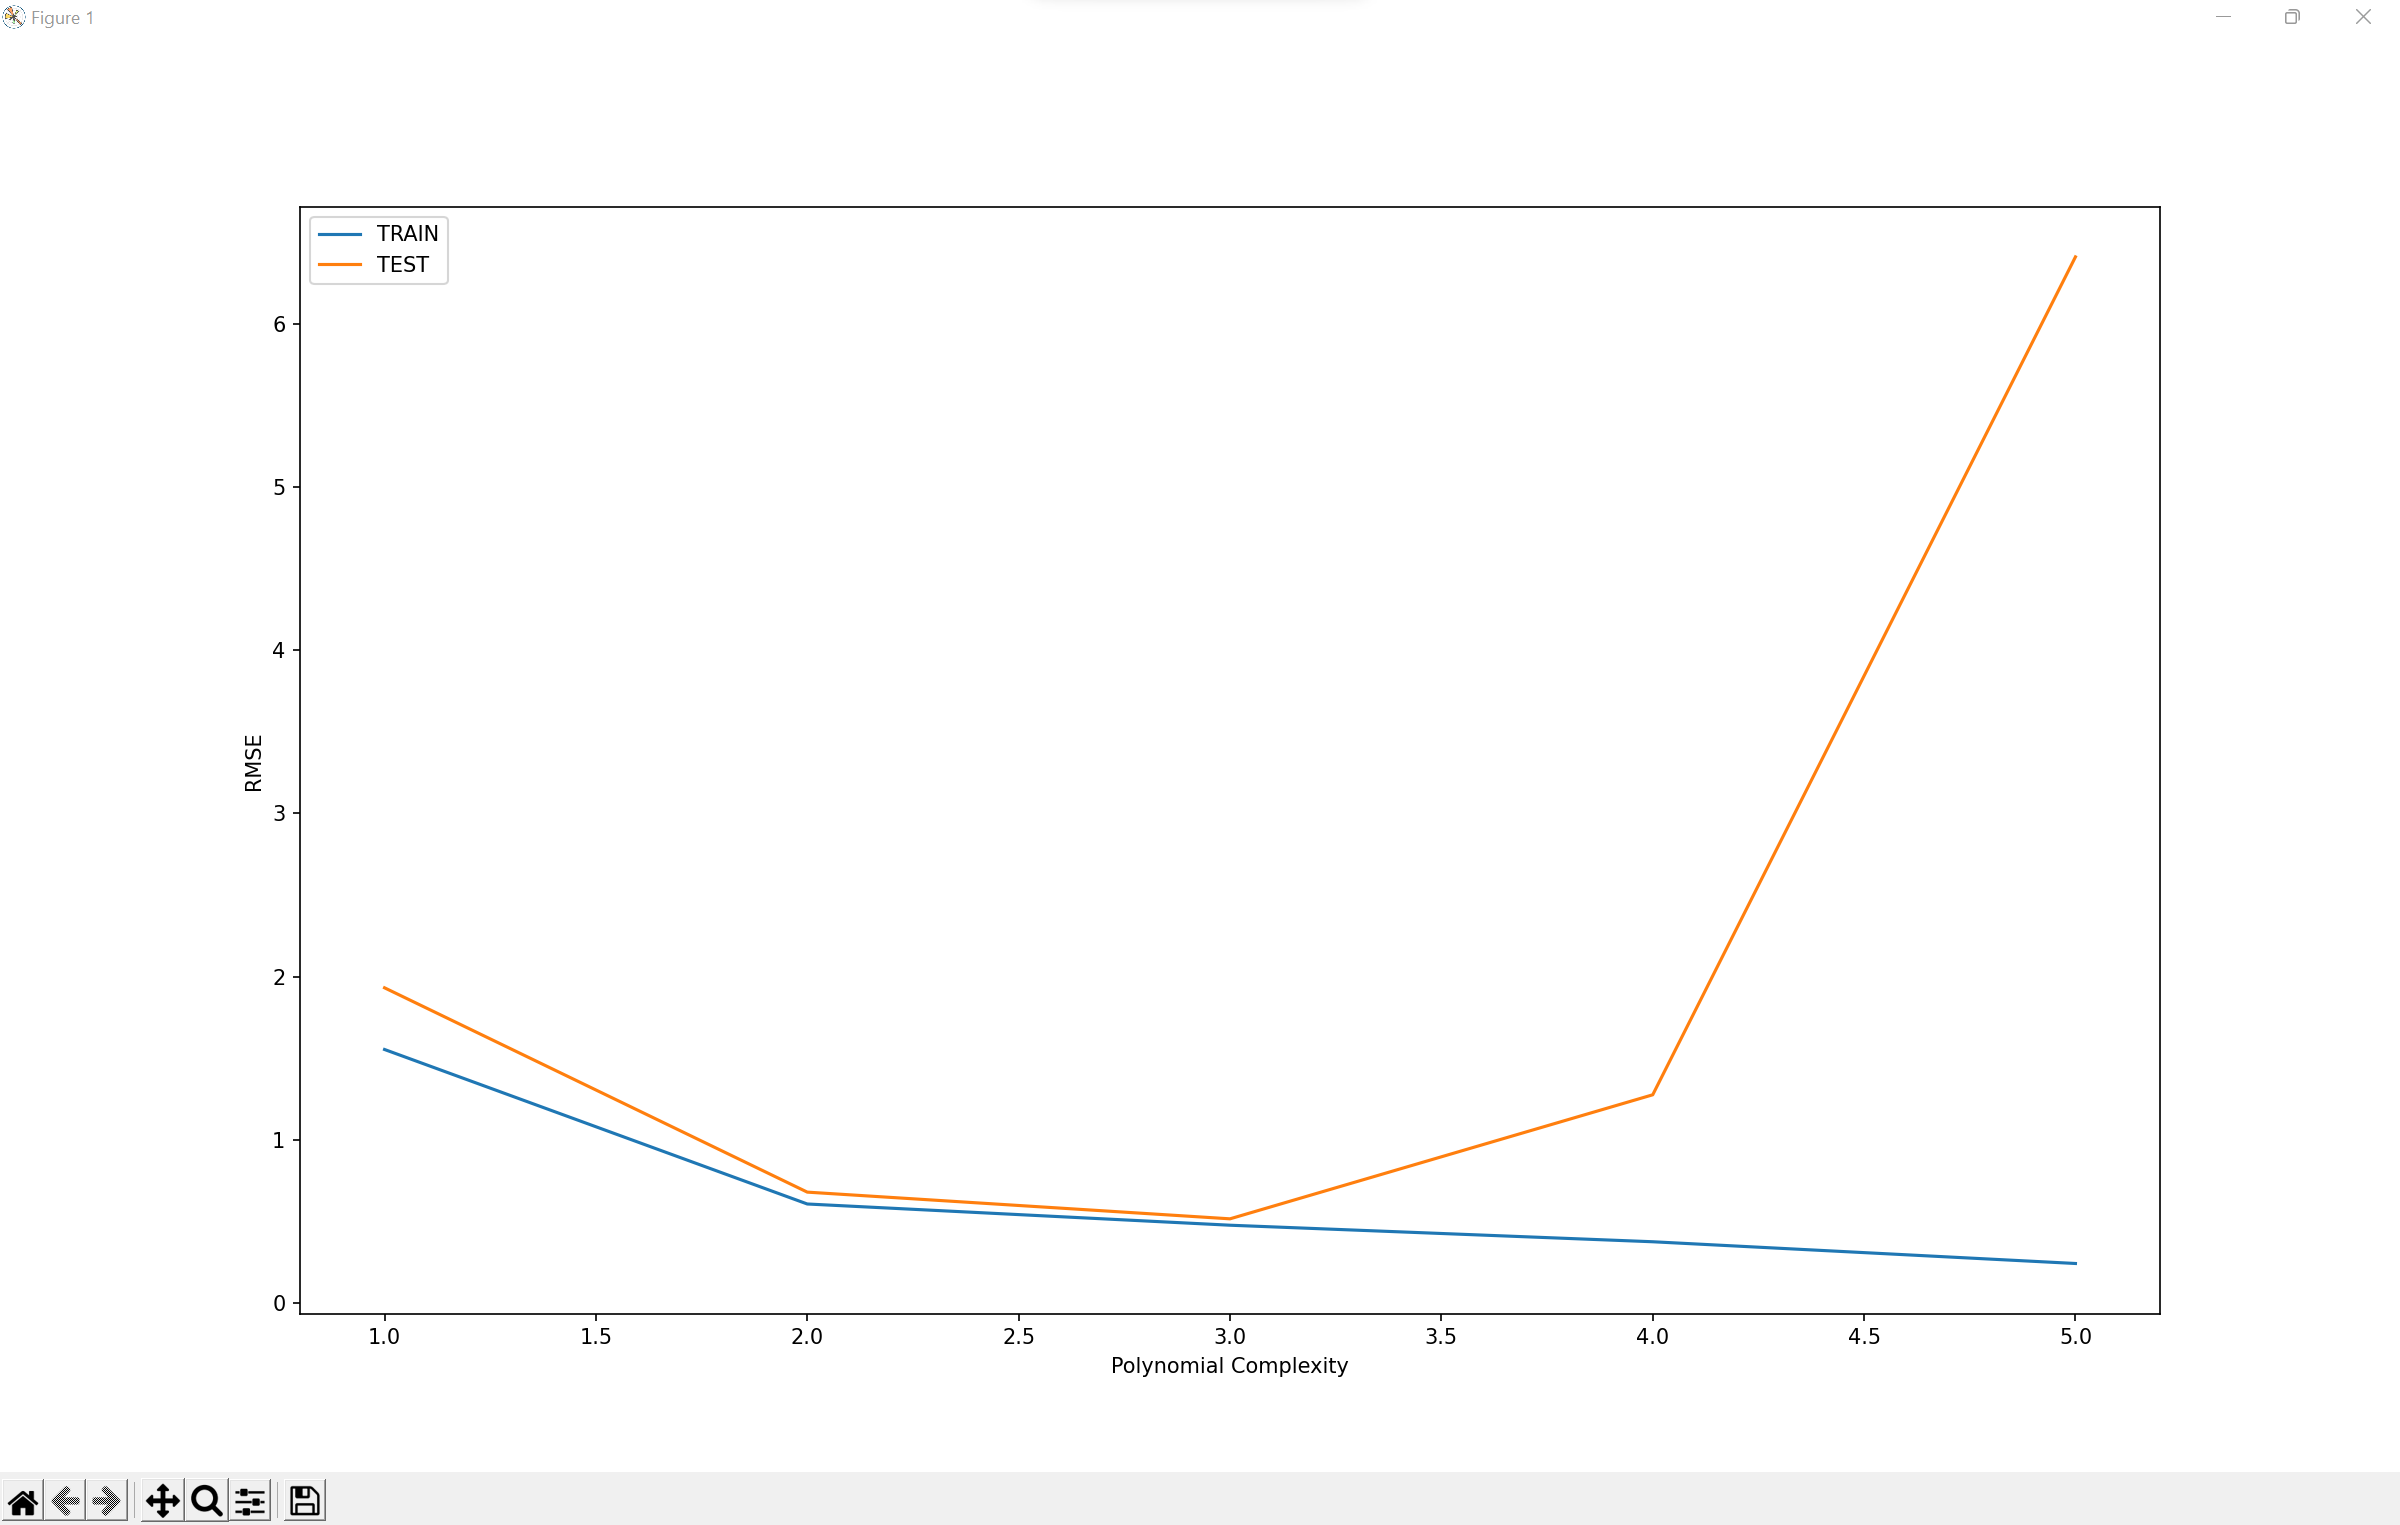
A polynomial regression model uses higher degrees of independent variables, making it possible to fit more complex datasets than a linear regression model, and hence providing more accurate predictions in situations where there are multiple independent variables with different degrees of impact on the dependent variable, such as predicting the number of sales based on ad spend on TV, newspaper, and radio. The graph presented below displays how the root mean square error changes with changes in the complexity degree of the polynomial. The model predicts well until the degree is 3, beyond which the model fails to make accurate predictions.
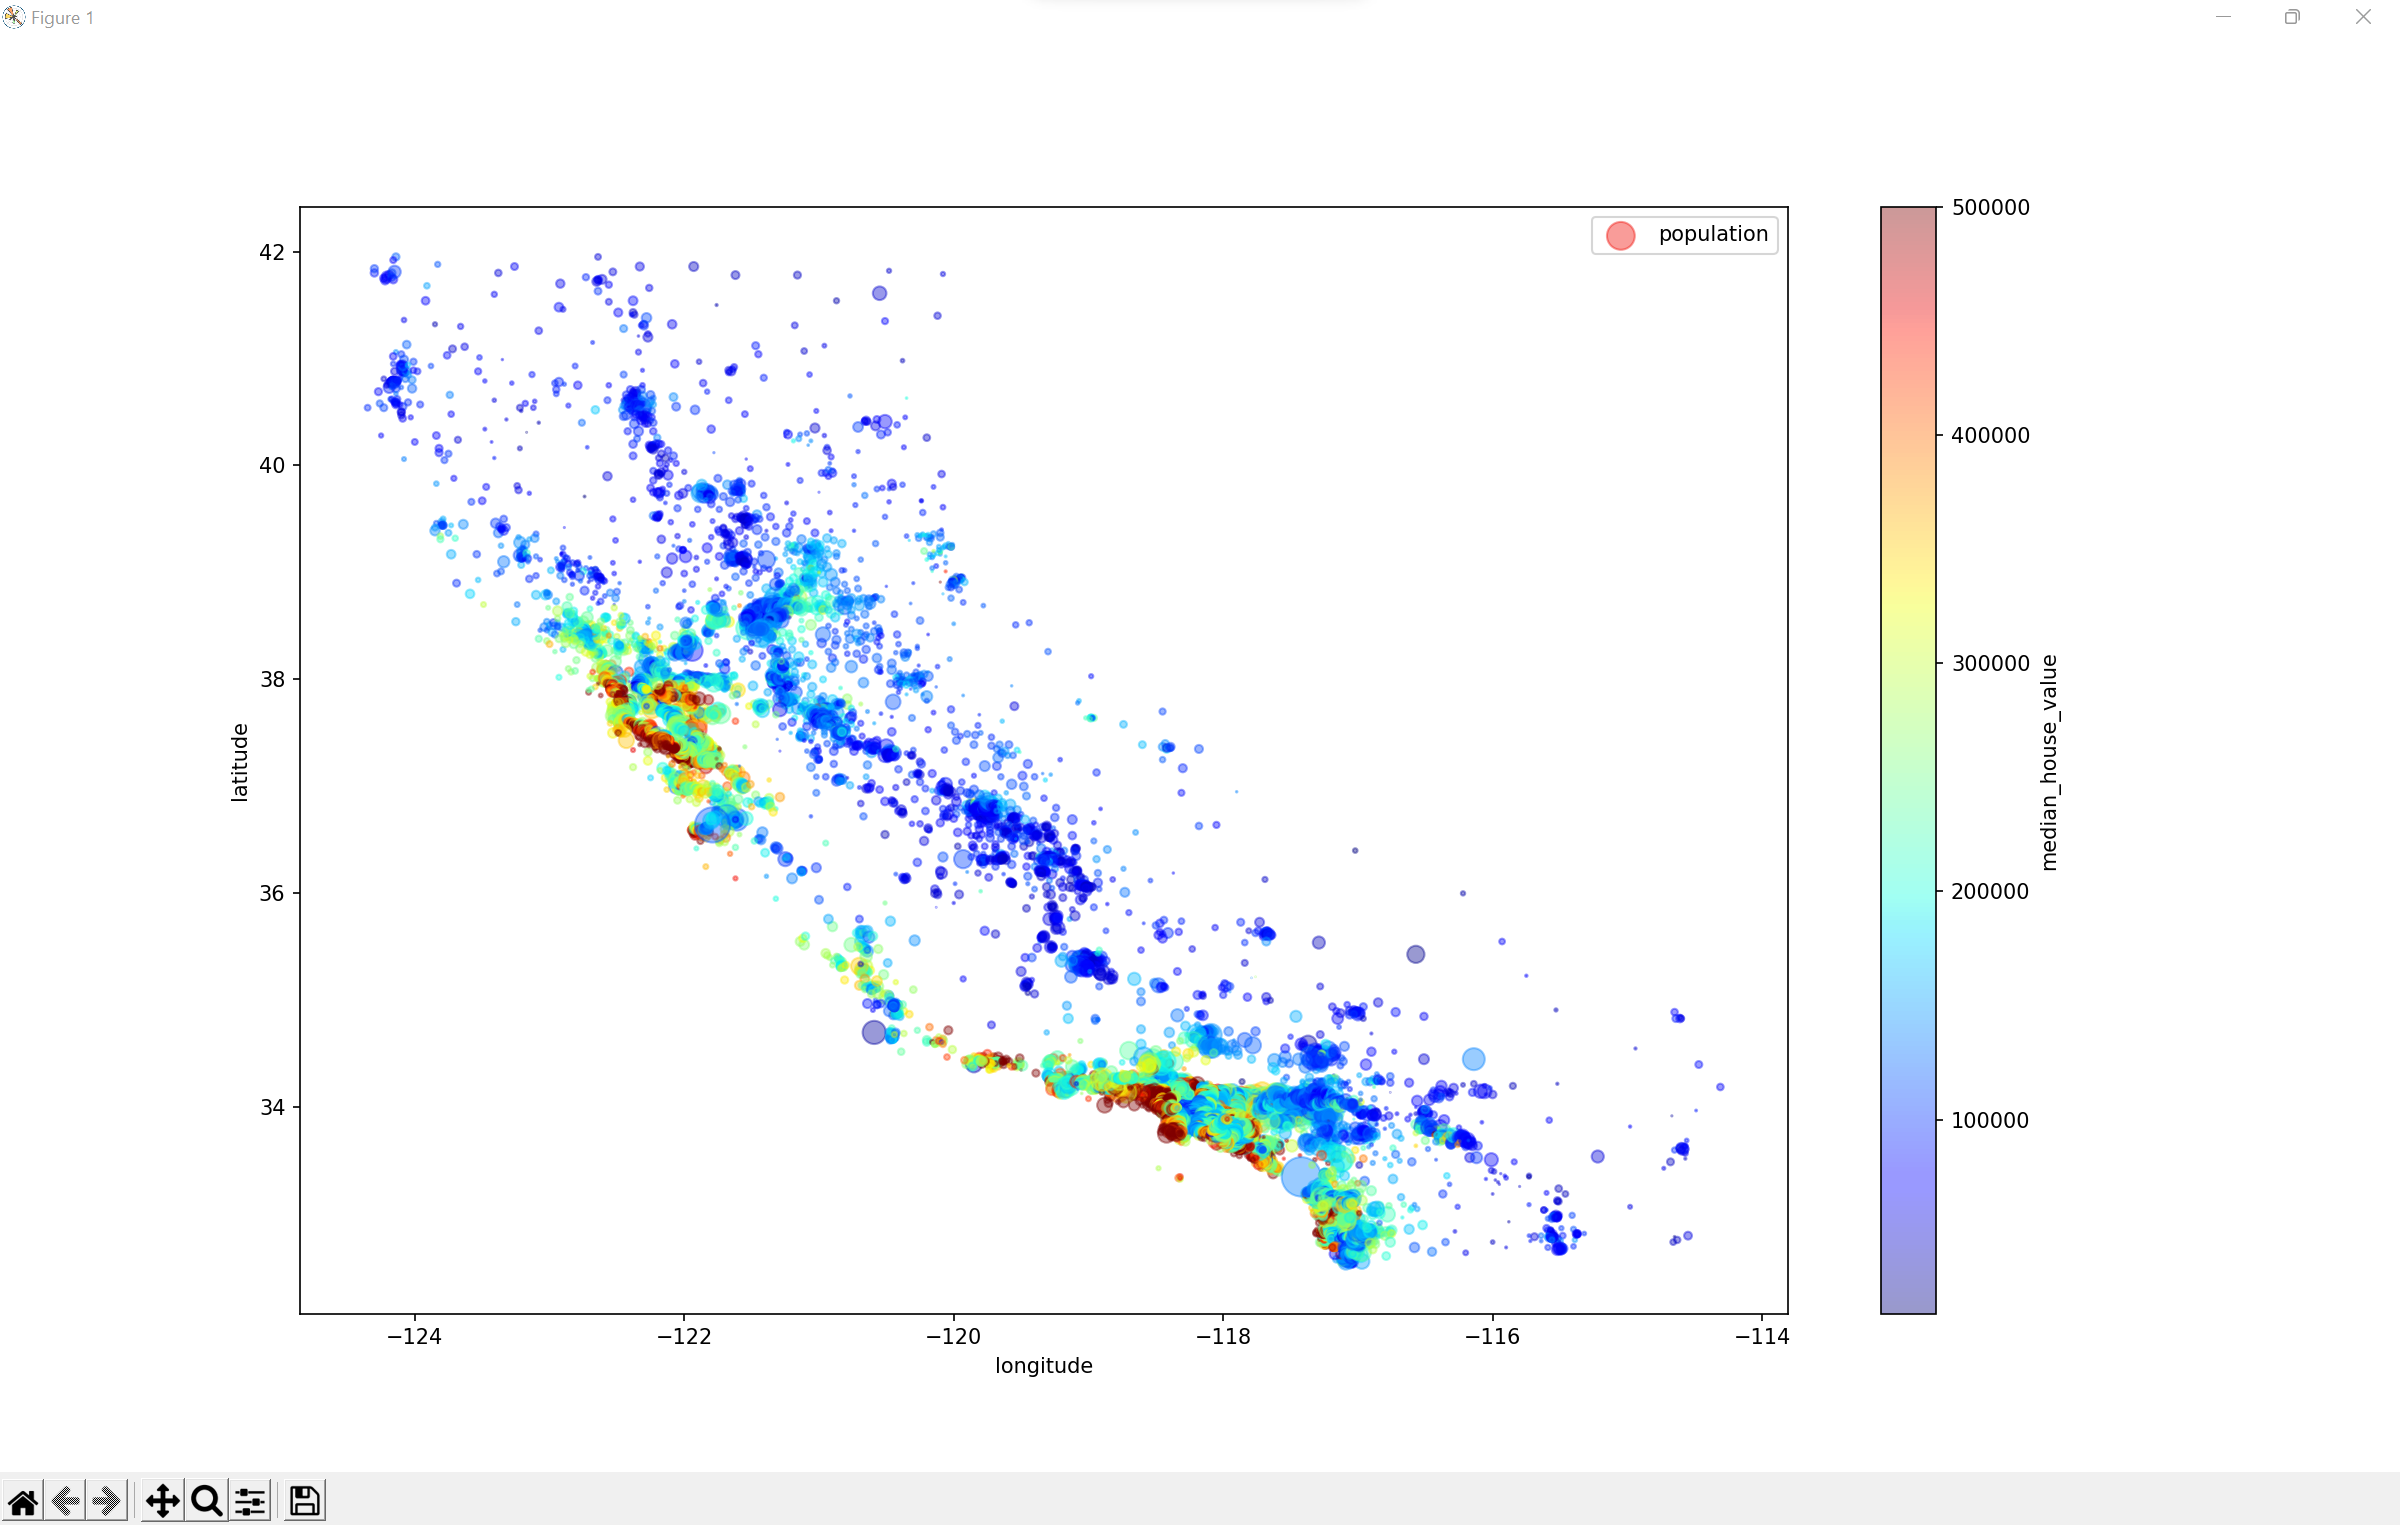
Random Forest Regression Model:
This random forest regression is a machine learning algorithm that can be used to predict the value of houses based on their location. With this algorithm, the input variables are the location-related features such as the zip code, neighborhood, or proximity to certain amenities, and the output is the predicted value of the property. This regression model is efficient and accurate as it can handle complex data sets with multiple input features and non-linear relationships between the input and output variables. With the help of this algorithm, real estate companies and individuals can obtain a more accurate prediction of a property's value based on its location, which can help them make more informed decisions regarding buying and selling homes.